
Proplot相关说明及示例
前言
今天发现一个python模块包: Proplot 。
它整合封装了matplotlib,cartopy,basemap。将画图命令精简整合,图窗和轴的排列更加智能整齐,可以说解决了我的很多痛点。但proplot的文档中给出的例子太少,我打算自己做一些例子,帮助自己学会proplot。
fig和ax的创建
fig,ax参数列表
Fig-Subplots
nrows: int; 子图行数
ncols: int;子图列数
space/wspace/hspace: float, str, None, turple;子图间距
refwidth: float; 子图宽度
refheight: float;子图高度
refaspect: float; 长宽比,默认1
figsize: tuple; 图窗大小
figwidth: float, str; 图窗宽度
figheight: float, str; 图窗高度
bottom/right/left/top: float, str, None; 图窗边界宽度
grid/xgrid/ygrid:bool; 网格线, 默认‘True’
Label-Ticksabc: str; 子图编号
abcloc: str; label位置
abc[size][color][weight]
title: str; 标题
titleloc:str; 标题位置
title[size][color][weight]
Axis-sharingshare/sharex/sharey: bool; 是否共享ticklabels,默认‘True’
span/spanx/spany: bool; 是否共享xlabel/ylabel,默认‘True’
与matplotlib相似,proplot支同时创建fig和ax,或者先创建fig,再逐步添加ax
1 | import proplt as pplt |
需要注意的是,subplots生成的是多个ax, 通过索引axs[0]访问单个ax。
1 | fig = pplt.figure() |
ax继承了matplotlib中ax的方法和属性(大致看了一下,应该是全部都继承了)。fig也是一样。
因此proplot几乎可以和matplotlib混用,加入投影参数后也继承了cartopy的方法和属性,同样可以实现混用。不同的是,proplot中ax对象分为三种:Cartesian,AxesGeoAxes,PolarAxes。与matplotlib和cartopy中的名称叫法不同。
子图间隔、宽度、高度
1 | import proplot as pplt |

space可分为wspace,和hspace,分别控制水平和垂直间隔。同样距离可加单位。
wspace和hspace可以为单一值,也可为元组形式。为元组时,对子图间两两间距进行设置。
refwidth提供相对长度和绝对长度,例如refwidth=‘2cm’即宽度2cm。
share参数
1 | import proplot as pplt |
share参数默认为True,即几个子图共享x,yticklabels。ticklabels只在图下和图左出现。
share=False取消共享,每个子图都画ticklabels。可分为sharex、sharey
子图划分和图窗边距
subplots接受一个多维数组或列表,用于划分子图分布。0表示此处不画子图,1表示第一个子图,2表示第二个子图…。根据传入的grid决定子图分布,而不用传入ncols和nrows
1 | import proplot as pplt |
](https://imgse.com/i/pp2eKij))
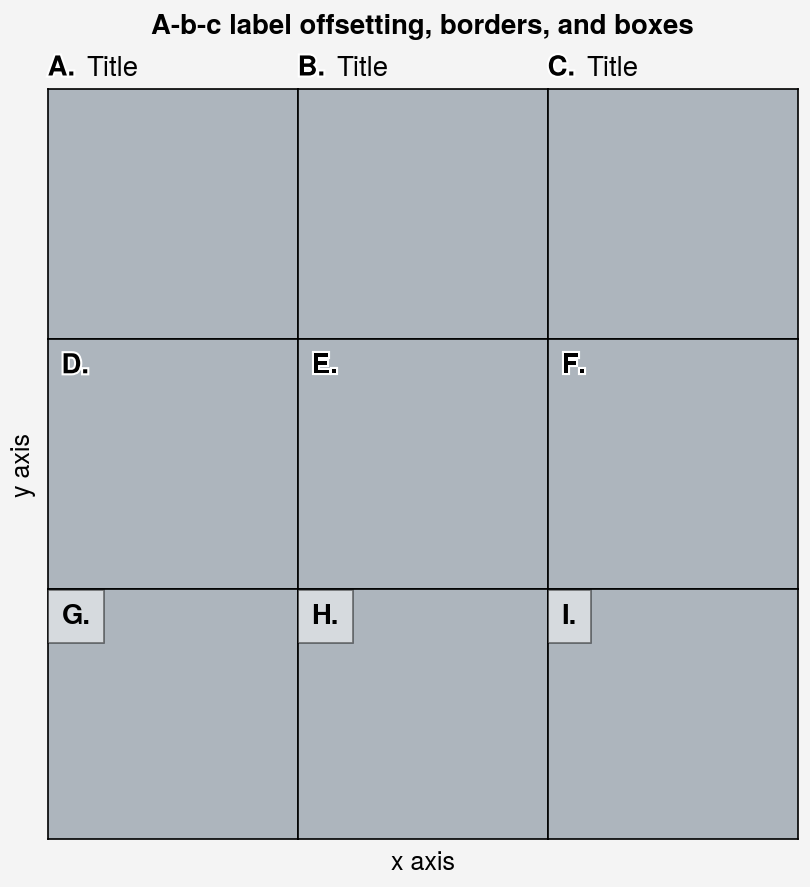
子图编号和标题
1 | import proplot as pplt |
笛卡尔坐标系
ticks and ticklabels
xlocater/xticks: (1) 直接输入int, 触发MultipleLocator,每隔int设置一个tick。
例xlocater=30
(2) 直接输入list,触发FixedLocator,ticks根据list中的值确定。
例xlocator=[0, 0.3, 0.8, 1.6, 4.4, 8, 8.8]
(3) 线性LinearLocator
例xlocator=(‘linear’, 21),根据xlim线性等分,设置21个ticks
(4) 对数LogLocator
例xlocator=‘log’,对数坐标
(5)最多刻度数MaxNLocator
例xlocator=(‘maxn’, 11)
(6) 无刻度NullLocator
例xlocator=‘null’,没有ticks
图像示例参见官方文档
ylocater/yticks同理。matplotlib中的Func自定义坐标轴趋势没有测试。即使不能在proplot中实现,将ax单独拎出来可以通过matplotlib实现。
还有xminorlocator,yminorlocator参数
此外还有xlim,ylim参数设置上下限。例xlim=(0, 10)